Technology · NEWS EXPLAINER
TSMC’s record quarter has two revenue growth rates: check the currency and the forecast
Q3 revenue rose 50.9% in Taiwan dollars and 41.2% in U.S. dollars. Reported earnings, next-quarter guidance and exploratory Texas plans answer different questions.
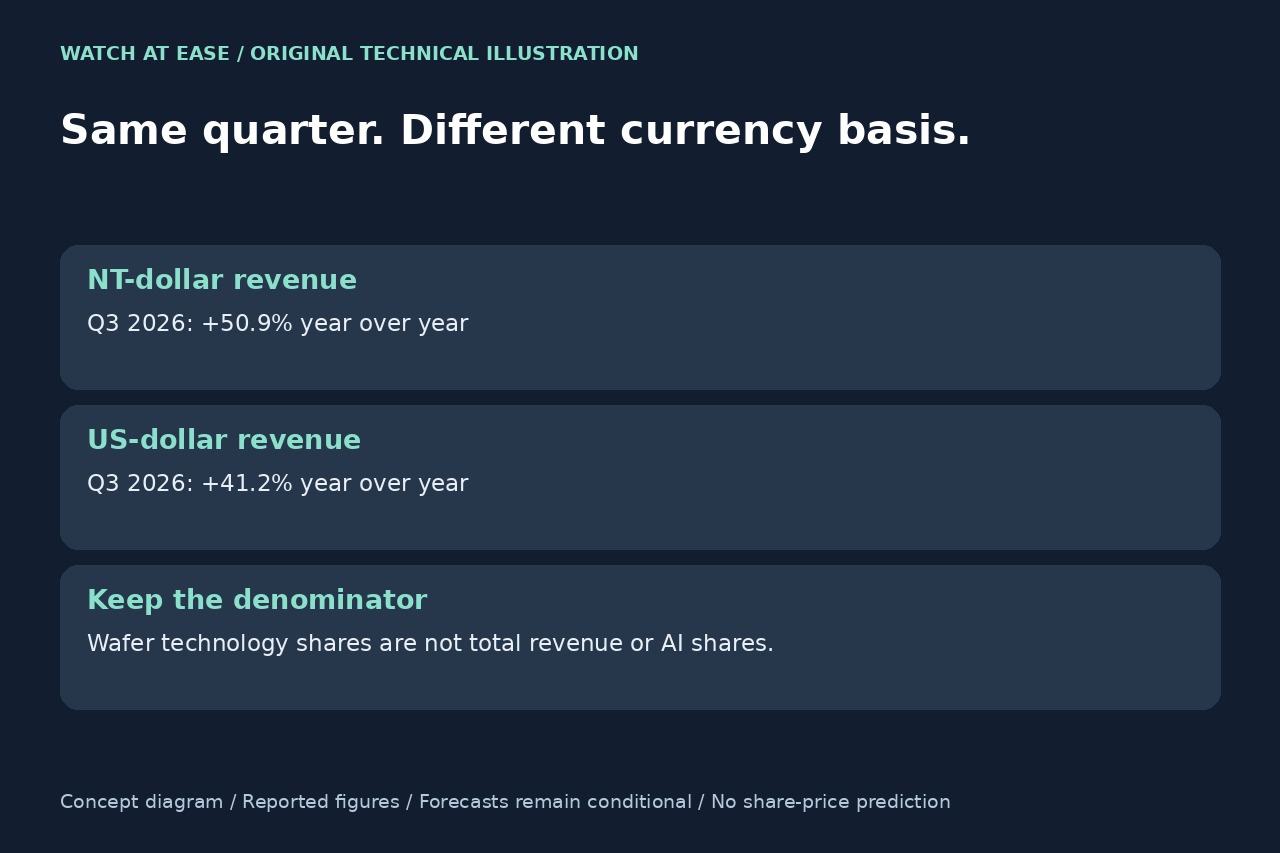
TSMC’s October 15 results put third-quarter revenue at NT$1,494.24 billion and net income at NT$763.06 billion. Revenue was up 50.9% from a year earlier in Taiwan dollars, but the company’s U.S.-dollar series rose 41.2% to $46.72 billion. Both figures are in the release; choosing one without its currency can make an otherwise accurate comparison misleading.
Keep the currency, period and metric together
The release reports NT-dollar revenue growth of 50.9% year on year and 17.6% quarter on quarter. Its U.S.-dollar figures are 41.2% and 16.2%, respectively. These are different reporting series, not competing estimates of one identically defined number. Readers comparing chipmakers should retain the currency and comparison period next to each percentage.
Net income is another metric: the reported NT$763.06 billion rose 68.7% from Q3 2025 and 8.0% from Q2 2026. Reuters reported an LSEG SmartEstimate of NT$746.3 billion drawn from 16 analysts, below the result. That consensus is an external comparison, while the result itself comes from TSMC’s consolidated reporting.
Revenue growth can coexist with a lower sequential margin
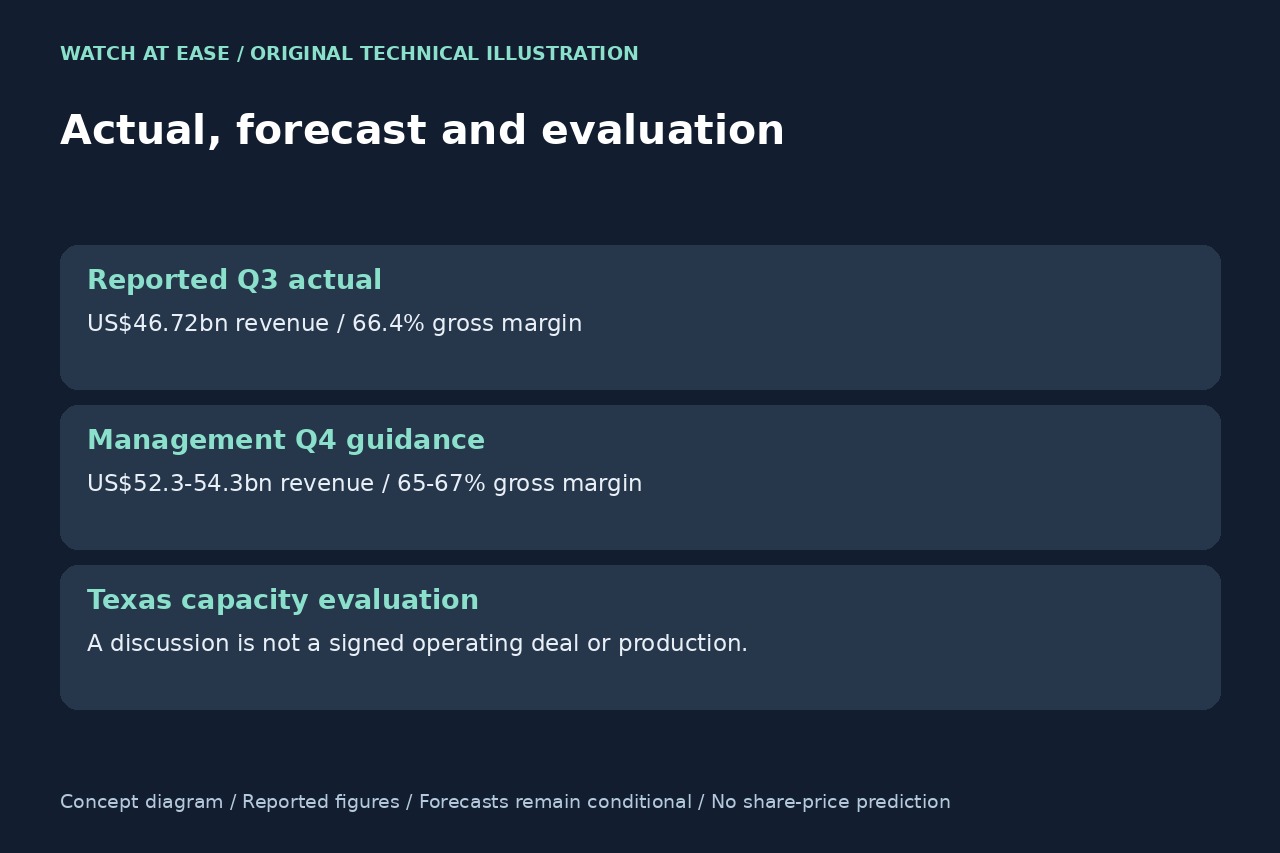
TSMC’s management report shows a 66.4% gross margin, compared with 67.7% in Q2. The decline is 1.3 percentage points, not a 1.3% fall in revenue. The company attributes the sequential dilution primarily to the initial ramp of its N2 technology. Operating margin also moved from 60.3% to 58.7%.
Advanced processes of 7 nanometers and below accounted for 79% of wafer revenue. Within that mix, 2nm contributed 8%, up from 3% in Q2. Those technology shares use wafer revenue as the denominator; they are not shares of total revenue or a direct measurement of AI revenue. A growing new-node share and temporary ramp-related margin pressure can therefore appear in the same report.
The next-quarter range is a forecast with assumptions
Management guides Q4 revenue to US$52.3–54.3 billion, with a gross margin of 65–67% and operating margin of 56.5–58.5%, using an exchange-rate assumption of NT$31.8 per U.S. dollar. The revenue midpoint, $53.3 billion, is about 14.1% above the reported Q3 U.S.-dollar revenue; that is our arithmetic on guidance, not an achieved growth result.
Reuters also reports that TSMC retained its 2026 capital-spending expectation of $60–64 billion. Investment spending, quarterly revenue and profit should not be added together as if they describe the same flow. The release cautions that forward-looking statements are subject to demand, capacity, competition, currency and other uncertainties.
Capacity discussions are not completed factories
AP’s original earnings-conference reporting says Texas is among the places TSMC is evaluating for expansion outside Arizona, and that a possible Terafab role remains under discussion. It also reports different public statements about who would operate a collaborative plant. The supported description is an evaluation, not a signed operating arrangement or a fab already producing chips.
Management’s strong AI-demand comments also sit alongside caution about consumer and price-sensitive markets. Neither statement cancels the other: they concern different demand conditions. Future results, firm project announcements and operating milestones will test those plans. This report explains the disclosed figures and their limits; it does not turn earnings growth into a share-price prediction.